
Tracing and performance
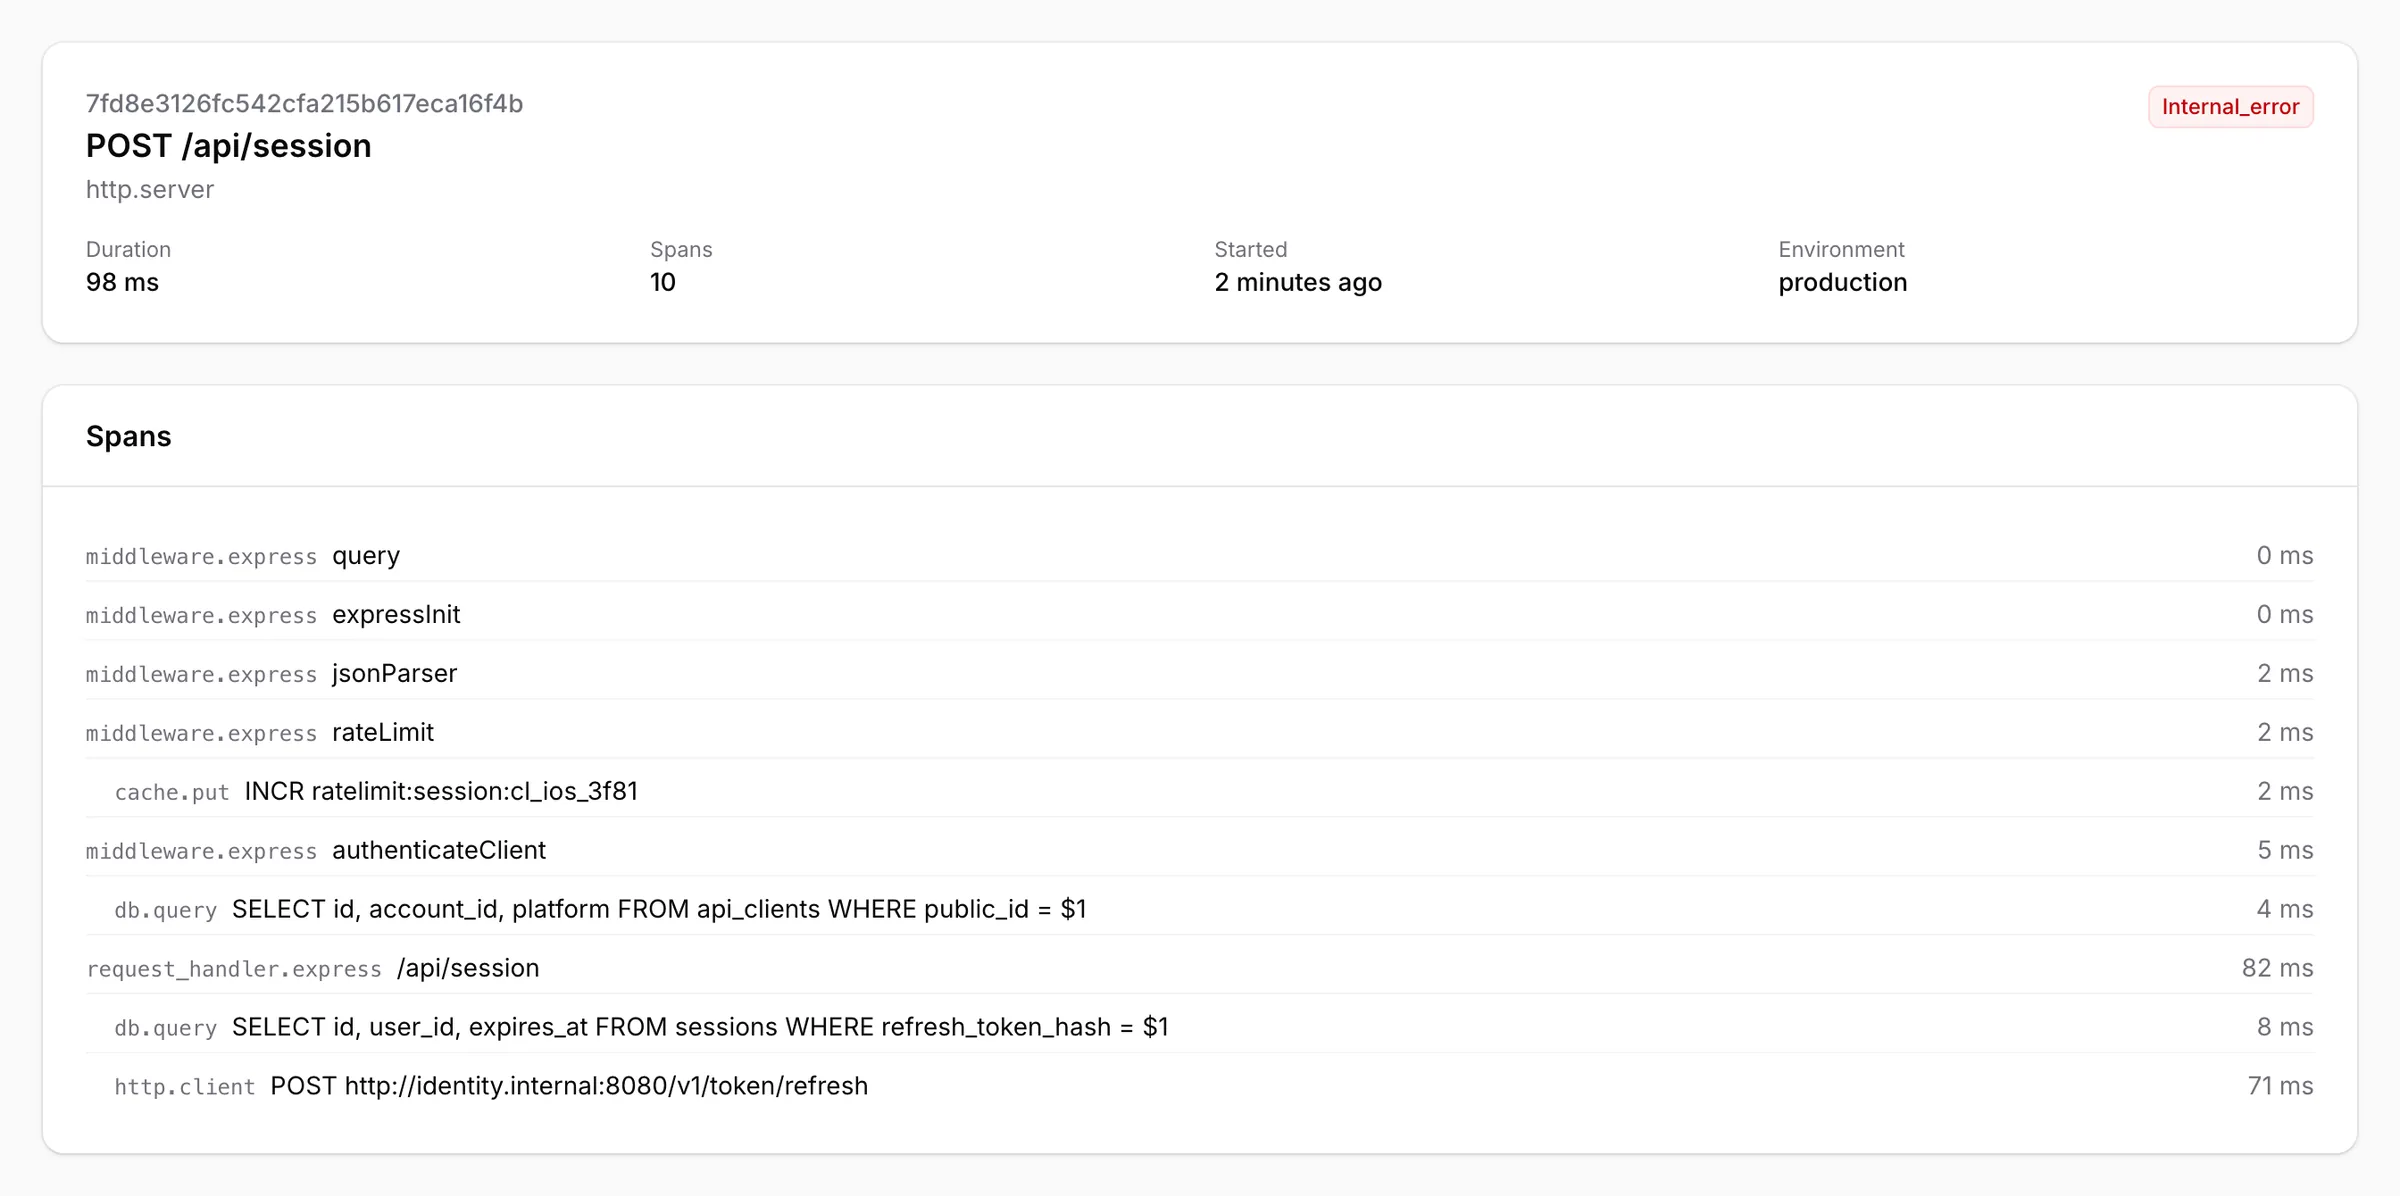
Transactions and spans from your SDK, a span tree for every trace, and errors linked to the request that caused them.
- Stored
- transactions and spans
- View
- span tree per trace
- Errors
- linked to their trace
- Metrics
- p95 and failure rate per project
Sentry.init({
  dsn: process.env.SENTRY_DSN,
  tracesSampleRate: 0.2,
});DeveloperYour coding agent can pick up any of these issues and fix it. How it works
Questions
Can I alert on slow responses?
Yes. Metric rules watch p95 and failure rate per project, by threshold, percent change or anomaly.
How does tracing help fix errors?
The trace shows what led to the throw, and your agent gets it with the issue.
Is tracing on the free plan?
Yes. Tracing is included on every plan.
A span tree, not a waterfall or flame graph, and no per-endpoint breakdown.